
Ultrafast Availability vs Uptake: The 2025 Update
How ultrafast broadband went from a lagging afterthought in 2022 to the UK's dominant connection type by 2025.
This is a follow-up to our original Ultrafast Availability vs Uptake report, published in 2022. Everything below has been refreshed with the latest coverage data (2024-2025); the 2022 figures are kept alongside them for comparison.
From Lagging Demand to the New Normal: Ultrafast Broadband in the UK, 2022-2025
Ofcom data, analysed by the team at BroadbandUK, originally showed that despite the UK Government's push to deliver Project Gigabit, ultrafast uptake was lagging well behind availability. We first wrote this report in 2022 to make that gap visible. Revisiting it now with the latest figures, the gap has essentially closed: Ultrafast has gone from a niche minority connection to the UK's dominant broadband tier.
Ofcom's Connected Nations 2022 report, based on data collected in May 2022, showed a shift away from Standard connections (<30 Mbit/s) to Superfast connections (30-300 Mbit/s), with Ultrafast (>300 Mbit/s) still lagging at just 9.64% of UK premises. Our own analysis of the latest local coverage data shows that by 2025, that figure has climbed to 86.41% — Ultrafast is no longer the exception, it's the norm.
Before we get into the data, let's remind ourselves of the Government's pledge to provide faster internet to rural and hard-to-reach areas in the UK, and see how that pledge has actually played out.
What is Project gigabit?
The UK Government's Project Gigabit is a multi-billion-pound plan to bring gigabit-capable broadband to hard-to-reach areas across the country. The goal of the project is to connect 85% of the UK to gigabit-capable broadband by the end of 2025.
In a winter 2023 update, the UK government provided new information on the progress of the Project Gigabit rollout. The government announced that it has reached agreements with more than 200 suppliers to deliver gigabit-capable broadband to hard-to-reach areas across the UK. These agreements will help to ensure that the project stays on track to meet its goal of reaching 85% of the UK by the end of 2025.
The government also announced that it has opened up applications for funding from the Gigabit Broadband Voucher Scheme, which provides funding to small and medium-sized businesses and residential properties in rural areas to help them access gigabit-capable broadband. The scheme has already provided vouchers to over 37,000 properties across the UK.
That target was 85% gigabit-capable coverage by the end of 2025. Our analysis of the latest Ofcom-derived coverage data shows gigabit-capable broadband now reaches 85.99% of UK premises — meaning the target has, in practice, been met.
Current full-fibre availability in the UK
In a recent statement by Ofcom's group director of network and communications, Lindsay Fussell, it was announced that full-fibre broadband is set to reach 50% of UK homes and businesses by March 2023, representing a significant milestone in the government's efforts to improve the country's broadband infrastructure.
That forecast proved conservative. By 2025, full-fibre coverage across the UK has reached 77.64% of premises, according to our analysis of the latest Ofcom Connected Nations data — well over the 50% milestone Ofcom was aiming for back in 2023.
What is the real picture? Availability vs uptake
| Region | Unavailable | +/- Unavailable | Superfast | +/- Superfast | Ultrafast | +/- Ultrafast | Full Fibre | Gigabit |
|---|---|---|---|---|---|---|---|---|
| East Midlands | 1.91% | -0.43% | 10.08% | -3.99% | 87.79% | +4.44% | 80.43% | 87.50% |
| East of England | 1.82% | -0.26% | 13.51% | -4.45% | 84.47% | +4.72% | 74.58% | 83.99% |
| London | 1.39% | -0.64% | 7.26% | -1.93% | 91.10% | +2.60% | 75.86% | 90.46% |
| North East | 2.14% | -0.34% | 9.07% | -5.33% | 88.62% | +5.65% | 73.41% | 88.28% |
| North West | 1.71% | -0.38% | 7.98% | -4.71% | 89.97% | +5.08% | 84.18% | 89.57% |
| Northern Ireland | 1.31% | -0.54% | 4.21% | -1.06% | 94.25% | +1.51% | 93.33% | 94.24% |
| Scotland | 3.31% | -0.83% | 16.43% | -3.01% | 79.95% | +3.86% | 69.99% | 79.65% |
| South East | 2.16% | -0.34% | 13.68% | -3.63% | 83.91% | +3.97% | 73.68% | 83.16% |
| South West | 3.87% | -0.53% | 16.79% | -2.64% | 79.04% | +3.17% | 71.93% | 78.66% |
| Wales | 3.29% | -0.39% | 16.29% | -6.23% | 80.02% | +6.66% | 75.76% | 79.65% |
| West Midlands | 2.00% | -0.33% | 8.27% | -2.99% | 89.48% | +3.35% | 79.72% | 89.18% |
| Yorkshire and The Humber | 1.84% | -0.29% | 6.53% | -3.62% | 91.52% | +3.99% | 88.35% | 91.30% |
| UK Total | 2.21% | -0.45% | 11.12% | -3.58% | 86.41% | +4.03% | 77.64% | 85.99% |
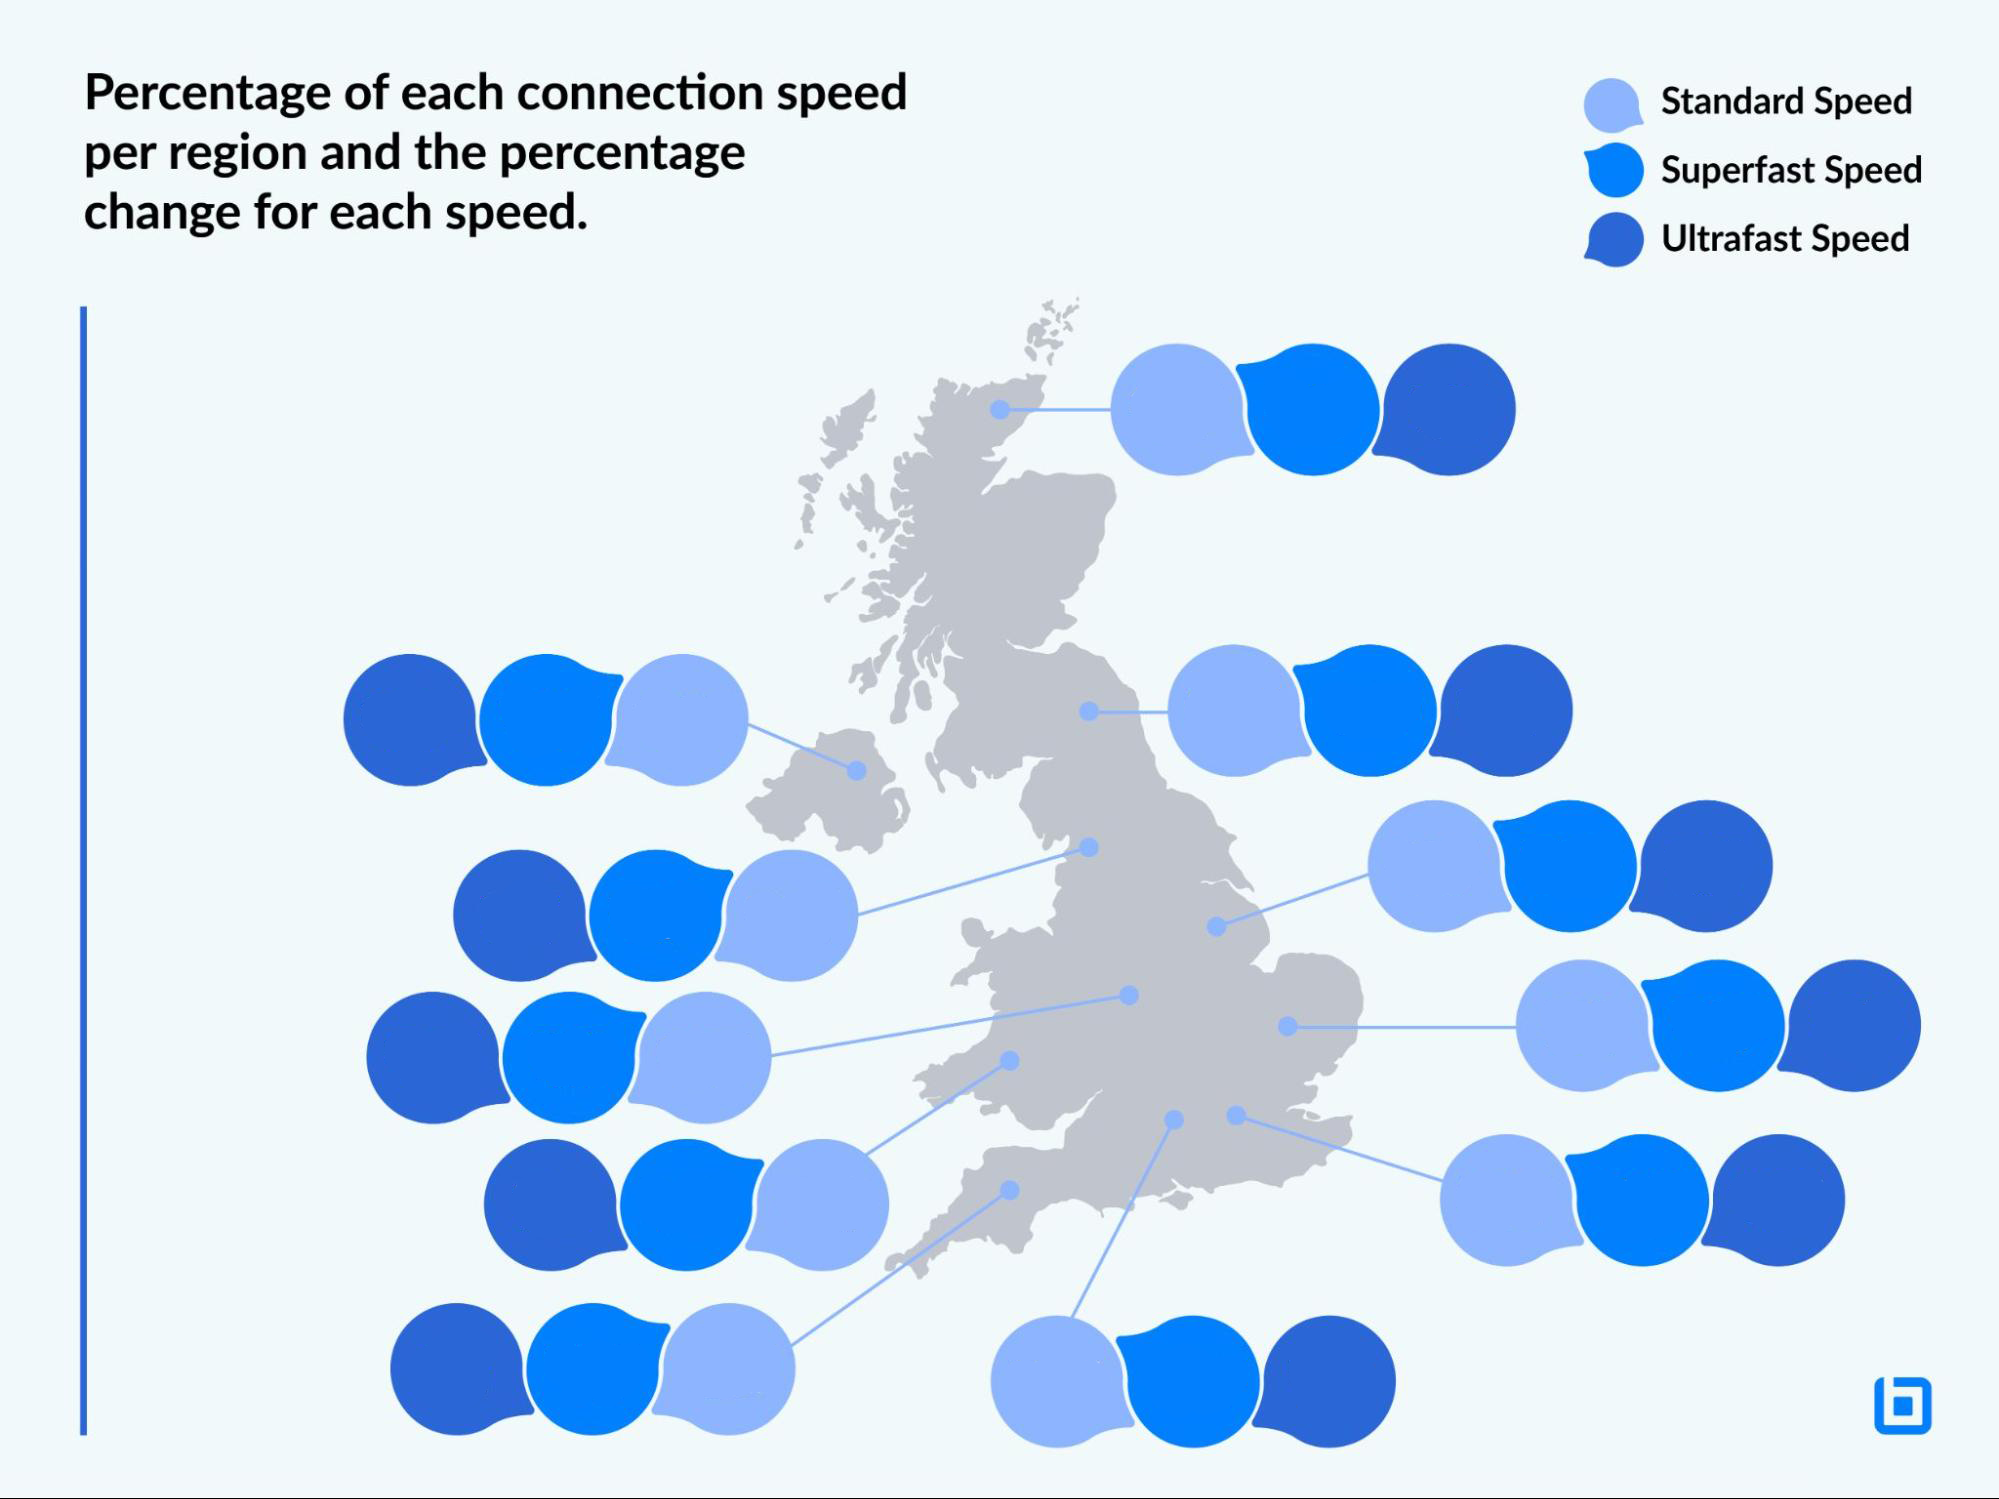
The graphic and supporting table present the distribution of internet connection types across UK regions, comparing where things stood in Ofcom's Spring 2022 Connected Nations report against our analysis of the latest coverage data (2024-2025). In 2022, the spread looked like this:
- Standard connections ranged from 11.79% in Greater London to 18.86% in the South West.
- Superfast connections ranged from 72.64% in the South West to 78.51% in Wales.
- Ultrafast connections ranged from just 5.31% in Wales to 12.56% in Greater London.
By 2025, every region has closed most of that gap:
- Premises unable to get superfast now range from just 1.31% in Northern Ireland to 3.87% in South West.
- The residual Superfast-only band — the fastest-growing tier back in 2022 — has shrunk to between 4.21% in Northern Ireland and 16.79% in South West, as those premises move on to Ultrafast instead.
- Ultrafast, the smallest tier everywhere in 2022, now ranges from 79.04% in South West to 94.25% in Northern Ireland. Northern Ireland in particular has gone from one of the more Standard-heavy regions in 2022 to the UK's Ultrafast leader.
Back in 2022, Standard connections had fallen fastest in Northern Ireland (-16.52 percentage points year-on-year) and slowest in the East of England (-11.93). The 2024-to-2025 comparison shows the same universal decline, just at a much smaller scale now there's less Standard left to shed: Scotland saw the biggest further improvement (-0.83 points), while East of England, already close to fully served, saw the smallest (-0.26 points).
Superfast was still the growth story in 2022, increasing fastest in Wales (+9.93 points) and slowest in Greater London (+5.84). The tables have turned: the Superfast-only band is now shrinking everywhere as those households upgrade to Ultrafast instead. Wales saw the largest fall (-6.23 points), while Northern Ireland, already mostly Ultrafast, saw the smallest (-1.06 points).
Ultrafast growth in 2022 was led by Greater London (+7.12 points) and lagged in Wales (+3.12). The 2025 data flips that ranking: Wales is now seeing the fastest further Ultrafast growth (+6.66 points), while Northern Ireland — already at 94.25% — has the least room left to grow (+1.51 points). Across the UK as a whole, premises unable to get superfast fell a further 0.45 points, the Superfast-only band shrank by 3.58 points, and Ultrafast grew by another 4.03 points to 86.41% — a world away from the 9.64% recorded in 2022.
At town/city level:
In 2022, this is where the extremes sat:
- The highest share of Standard connection speed was found in Kirkwall (38.37%), while the lowest was in Hull (8.05%) and Harrow (9.84%). The largest declines in Standard connection speeds were seen in Hull (-16.57%) and Belfast (-16.52%).
- Superfast connection speeds were highest in Cardiff (81.29%) and lowest in Hull (55.90%) and Kirkwall (61.45%). The largest increase in Superfast connection speeds was seen in Llandrindod (12.57%).
- Hull came out on top for Ultrafast connections (36.05%), followed by Sutton (14.01%), whilst the lowest was Comhairle nan Eilean Siar (0.35%). The largest increase in Ultrafast connection speeds was observed in Hull (22.51%), followed by Salisbury (8.09%).
By 2025, the leaderboard looks very different:
- Kirkwall is still the town with the most ground left to make up on superfast access — though its unavailability rate has fallen from 38.37% to 15.00% — while Southend now leads the country at just 0.20% unable to get superfast.
- The Superfast-only band that Cardiff and Hull once anchored has become the shrinking middle ground everywhere, as premises move straight to Ultrafast instead. It's now largest in Comhairle nan Eilean Siar (69.60%, where Ultrafast infrastructure has been slower to arrive) and smallest in Southend (1.20%, which has moved almost entirely to Ultrafast instead).
- Hull's early lead has been comprehensively overtaken: Southend now tops the table at 98.50% Ultrafast availability, and even last-placed Comhairle nan Eilean Siar has climbed to 10.30% — roughly thirty times its 2022 level of 0.35%.
- It's not uniformly one-way traffic: Exeter's Ultrafast share actually dipped slightly (-2.10 points) between 2024 and 2025, a reminder that local rollout timing and network upgrades can cause short-term dips even as the national trend heads firmly upward. Carlisle saw the opposite: the fastest Ultrafast growth of any town in this list (+19.40 points).
Note: KCOM rolled out its full fibre network in Hull back in 2019, putting the city years ahead of the rest of the UK at the time — reflected in Hull's 2022 lead above. By 2025, the rest of the country has largely caught up: Hull's Ultrafast availability (94.86%, see the full table below) is now solidly mid-table rather than a national outlier.
Saveen Rajan, CEO of BroadbandUK, commented back in 2022:
“Despite the continuous expansion of Ultrafast broadband infrastructure across the UK, there is a significant gap between its availability and the actual uptake by consumers. This underscores the urgent need for not only increasing public awareness about the benefits of Ultrafast connections but also effectively addressing affordability concerns.”
Revisiting that comment in 2025, Saveen adds:
“What's striking is how quickly that gap closed once full-fibre and gigabit-capable networks became the default for new and upgraded connections, rather than a premium add-on. The barriers we flagged in 2022 — cost, awareness, contract lock-in — haven't disappeared, but the data shows they mattered less than we expected once availability reached critical mass.”
A full breakdown by town/city is shown below:
| Town/City | Unavailable | +/- Unavailable | Superfast | +/- Superfast | Ultrafast | +/- Ultrafast | Full Fibre | Gigabit |
|---|---|---|---|---|---|---|---|---|
| Aberdeen | 1.60% | -0.80% | 6.10% | -1.70% | 92.20% | +2.50% | 91.80% | 91.80% |
| Bath | 3.60% | -0.30% | 16.40% | -8.10% | 79.80% | +8.40% | 70.50% | 77.50% |
| Belfast | 1.00% | +0.10% | 3.60% | +0.30% | 95.40% | -0.20% | 91.80% | 95.40% |
| Birmingham | 1.42% | -0.44% | 3.62% | -1.86% | 94.60% | +2.36% | 84.04% | 94.49% |
| Blackburn | 1.25% | -0.29% | 6.26% | -3.55% | 92.39% | +3.91% | 89.05% | 92.21% |
| Blackpool | 0.90% | -0.28% | 7.27% | -5.24% | 91.53% | +5.66% | 78.40% | 91.43% |
| Bolton | 0.70% | -0.30% | 4.10% | -1.70% | 94.80% | +1.90% | 86.10% | 94.40% |
| Bournemouth | 0.80% | -0.10% | 9.50% | +0.10% | 89.20% | -0.20% | 78.40% | 88.70% |
| Bradford | 1.40% | -0.31% | 3.31% | -1.98% | 95.15% | +2.35% | 90.32% | 94.88% |
| Brighton | 1.10% | -0.60% | 9.60% | -2.40% | 88.50% | +3.10% | 61.10% | 85.90% |
| Bristol | 2.63% | -0.64% | 7.49% | -3.35% | 89.49% | +3.78% | 79.46% | 88.76% |
| Bromley | 1.20% | -0.29% | 6.98% | -1.62% | 91.52% | +2.01% | 67.77% | 91.18% |
| Cambridge | 2.20% | -0.40% | 14.30% | -3.50% | 83.40% | +3.80% | 57.40% | 82.90% |
| Canterbury | 3.10% | -0.60% | 21.70% | -8.50% | 72.50% | +9.20% | 72.50% | 72.50% |
| Cardiff | 1.60% | +0.16% | 6.04% | -2.25% | 92.00% | +2.15% | 83.80% | 91.33% |
| Carlisle | 3.70% | -1.20% | 22.70% | -18.30% | 73.40% | +19.40% | 71.80% | 73.20% |
| Chelmsford | 2.10% | -0.70% | 10.50% | -6.90% | 87.20% | +7.60% | 79.20% | 86.30% |
| Chester | 2.30% | -0.44% | 9.48% | -5.55% | 88.12% | +6.05% | 87.03% | 87.45% |
| Cleveland | 1.80% | +0.00% | 7.80% | -0.30% | 90.40% | +0.40% | 59.00% | 90.20% |
| Colchester | 2.00% | +0.10% | 15.70% | -3.80% | 81.30% | +3.50% | 61.50% | 81.30% |
| Comhairle nan Eilean Siar | 12.50% | -2.40% | 69.60% | -2.40% | 10.30% | +4.70% | 10.30% | 10.30% |
| Coventry | 0.63% | -0.17% | 5.30% | -0.79% | 93.39% | +0.89% | 79.58% | 92.62% |
| Crewe | 3.10% | -0.30% | 13.30% | -2.20% | 83.50% | +2.60% | 77.00% | 82.90% |
| Croydon | 3.00% | -0.60% | 8.90% | -0.70% | 88.00% | +1.30% | 57.90% | 88.00% |
| Darlington | 2.60% | -0.50% | 6.20% | -1.00% | 91.10% | +1.40% | 77.00% | 91.00% |
| Dartford | 1.10% | -0.60% | 14.40% | -4.50% | 84.40% | +5.10% | 65.60% | 83.60% |
| Derby | 0.95% | -0.57% | 5.68% | -4.10% | 93.20% | +4.91% | 87.92% | 93.01% |
| Doncaster | 0.80% | -0.30% | 3.70% | -6.30% | 95.40% | +6.60% | 93.60% | 95.40% |
| Dorchester | 2.60% | -0.70% | 25.80% | -1.80% | 71.50% | +2.60% | 70.10% | 71.40% |
| Dudley | 0.30% | -0.20% | 2.30% | -3.10% | 97.40% | +3.50% | 88.00% | 97.00% |
| Dumfries | 3.50% | -3.30% | 44.60% | -15.10% | 51.80% | +18.50% | 51.80% | 51.80% |
| Dundee | 0.80% | +0.00% | 4.40% | +0.00% | 94.70% | -0.10% | 84.40% | 93.90% |
| Durham | 2.10% | -1.20% | 15.30% | -16.00% | 82.40% | +17.10% | 80.60% | 81.90% |
| Edinburgh | 1.60% | +0.00% | 5.10% | -0.50% | 93.20% | +0.60% | 83.00% | 92.20% |
| Enfield | 1.00% | -0.70% | 7.10% | -1.20% | 91.30% | +2.00% | 49.20% | 90.70% |
| Exeter | 2.60% | +0.30% | 7.20% | +1.80% | 89.90% | -2.10% | 78.80% | 89.90% |
| Falkirk | 1.30% | -0.70% | 5.30% | -0.80% | 93.30% | +1.40% | 65.30% | 93.30% |
| Galashiels | 2.40% | -2.90% | 28.70% | -2.30% | 68.70% | +5.30% | 68.30% | 68.30% |
| Glasgow | 1.00% | -0.50% | 3.30% | -1.70% | 95.20% | +2.00% | 91.50% | 94.60% |
| Gloucester | 0.60% | -0.10% | 5.70% | -1.00% | 93.70% | +1.20% | 56.20% | 93.70% |
| Guilford | 1.80% | -0.30% | 16.50% | -2.40% | 81.50% | +2.60% | 63.10% | 79.40% |
| Halifax | 3.10% | -0.80% | 19.20% | -12.90% | 77.60% | +13.70% | 74.40% | 77.50% |
| Harrogate | 4.70% | -0.40% | 16.10% | -8.60% | 79.00% | +9.00% | 78.40% | 78.70% |
| Harrow | 1.10% | -0.40% | 9.50% | -1.90% | 89.40% | +2.40% | 76.80% | 89.40% |
| Hemel | 2.20% | +0.00% | 13.00% | -0.70% | 84.70% | +0.70% | 62.00% | 84.10% |
| Hereford | 4.80% | -0.80% | 12.40% | -2.90% | 82.70% | +3.80% | 83.20% | 83.20% |
| Huddersfield | 1.10% | -0.40% | 5.00% | -2.40% | 93.80% | +2.80% | 91.10% | 93.80% |
| Ilford | 0.90% | -0.10% | 5.50% | -1.30% | 93.50% | +1.40% | 84.60% | 93.10% |
| Inverness | 13.60% | +0.20% | 24.90% | -12.20% | 60.20% | +12.00% | 60.20% | 60.20% |
| Ipswich | 1.70% | -0.42% | 13.83% | -9.56% | 84.21% | +10.06% | 83.16% | 83.97% |
| Kilmarnock | 1.50% | -0.10% | 20.20% | -0.20% | 78.30% | +0.80% | 75.30% | 78.00% |
| Kingston | 1.09% | -0.35% | 6.94% | -1.14% | 91.77% | +1.50% | 66.71% | 90.76% |
| Kingston upon Hull | 1.03% | -0.17% | 3.83% | -2.46% | 94.86% | +2.88% | 94.86% | 94.86% |
| Kirkaldy | 1.30% | -0.40% | 17.40% | -2.10% | 81.00% | +2.60% | 67.80% | 80.90% |
| Kirkwall | 15.00% | -8.10% | 58.70% | -3.00% | 24.90% | +11.40% | 24.90% | 24.90% |
| Lancaster | 1.30% | -0.10% | 10.20% | -0.80% | 88.40% | +1.00% | 85.90% | 88.00% |
| Leeds | 1.40% | -0.20% | 2.80% | -1.10% | 95.70% | +1.40% | 92.30% | 95.50% |
| Leicester | 0.53% | -0.20% | 6.74% | -2.92% | 92.70% | +3.17% | 87.45% | 92.26% |
| Lincoln | 0.70% | -0.30% | 4.40% | -2.00% | 91.80% | +2.30% | 86.00% | 91.80% |
| Liverpool | 2.87% | +0.32% | 5.24% | -0.87% | 91.34% | +0.30% | 86.18% | 90.96% |
| Llandrindod | 11.90% | -1.60% | 29.90% | -10.30% | 57.00% | +11.90% | 57.00% | 57.00% |
| Llandudno | 3.40% | -0.40% | 10.90% | -2.60% | 85.60% | +3.00% | 85.60% | 85.60% |
| London | 1.39% | -0.64% | 7.26% | -1.93% | 91.10% | +2.60% | 75.86% | 90.46% |
| Luton | 1.22% | -0.17% | 7.71% | -1.78% | 90.81% | +2.05% | 81.46% | 90.13% |
| Manchester | 1.45% | -0.65% | 5.66% | -1.90% | 91.62% | +2.41% | 84.70% | 91.30% |
| Medway | 1.60% | -0.10% | 7.10% | -2.00% | 91.20% | +2.10% | 79.60% | 89.60% |
| Milton Keynes | 0.50% | -0.70% | 3.50% | -1.70% | 95.90% | +2.30% | 95.70% | 95.70% |
| Motherwell | 1.40% | +0.00% | 6.60% | -1.60% | 91.90% | +1.50% | 63.80% | 91.70% |
| Newcastle | 1.60% | -0.30% | 5.10% | -1.20% | 93.10% | +1.50% | 88.10% | 92.40% |
| Newport | 1.50% | -0.20% | 5.90% | -3.10% | 92.50% | +3.40% | 85.50% | 92.30% |
| Northampton | 1.30% | -0.10% | 4.00% | -1.20% | 94.20% | +1.40% | 93.10% | 94.00% |
| Norwich | 2.36% | -0.44% | 20.47% | -8.38% | 76.65% | +8.49% | 69.86% | 76.06% |
| Nottingham | 0.60% | -0.90% | 2.40% | -1.90% | 97.00% | +2.80% | 85.70% | 96.70% |
| Oldham | 0.50% | +0.00% | 2.50% | -1.60% | 97.00% | +1.90% | 93.30% | 97.00% |
| Oxford | 1.10% | -0.30% | 16.60% | -0.20% | 79.70% | +0.40% | 38.20% | 76.10% |
| Paisley | 0.80% | -0.90% | 3.50% | -1.70% | 95.70% | +2.60% | 90.70% | 95.70% |
| Perth | 8.30% | -2.70% | 39.20% | -4.00% | 52.20% | +6.70% | 32.80% | 51.40% |
| Peterborough | 1.18% | -0.35% | 6.05% | -4.19% | 92.53% | +4.54% | 85.88% | 92.29% |
| Plymouth | 4.63% | -0.16% | 11.71% | -0.98% | 82.94% | +1.08% | 70.72% | 82.68% |
| Portsmouth | 0.79% | -0.53% | 2.14% | -2.16% | 97.00% | +2.65% | 83.91% | 96.61% |
| Preston | 0.90% | -0.50% | 11.20% | -6.90% | 87.70% | +7.80% | 71.20% | 87.60% |
| Reading | 1.02% | -0.27% | 6.44% | -2.24% | 92.47% | +2.51% | 84.52% | 91.48% |
| Redhill | 1.50% | -0.10% | 11.10% | -0.80% | 87.30% | +0.90% | 73.60% | 87.20% |
| Romford | 1.10% | -0.80% | 6.60% | -1.50% | 92.00% | +2.00% | 84.20% | 91.30% |
| Salisbury | 3.00% | -0.50% | 22.10% | -5.90% | 74.70% | +6.40% | 66.50% | 74.50% |
| Sheffield | 1.83% | -0.14% | 4.19% | -2.34% | 93.96% | +2.55% | 91.57% | 93.78% |
| Shetland | 14.90% | -7.20% | 67.50% | +0.80% | 17.20% | +6.70% | 17.20% | 17.20% |
| Shrewsbury | 7.90% | -0.60% | 18.60% | -4.70% | 73.30% | +5.30% | 71.70% | 72.50% |
| Slough | 2.34% | -0.33% | 13.33% | -3.02% | 84.22% | +3.42% | 75.38% | 83.04% |
| Southall | 1.31% | -0.33% | 6.66% | -1.40% | 91.71% | +1.68% | 76.40% | 90.93% |
| Southampton | 1.59% | -0.15% | 4.83% | -3.66% | 93.22% | +3.61% | 82.92% | 92.78% |
| Southend | 0.20% | -0.20% | 1.20% | -0.80% | 98.50% | +1.00% | 97.60% | 98.30% |
| St Albans | 1.20% | -0.10% | 4.60% | -1.40% | 94.00% | +1.40% | 79.80% | 93.30% |
| Stevenage | 1.49% | -0.05% | 10.86% | -0.28% | 87.65% | +0.43% | 65.86% | 87.34% |
| Stockport | 0.80% | -0.20% | 4.50% | -1.90% | 94.40% | +1.90% | 84.70% | 94.40% |
| Stoke on Trent | 1.63% | +0.23% | 8.34% | -0.74% | 89.80% | +0.45% | 81.88% | 89.76% |
| Sunderland | 1.50% | -0.20% | 5.20% | -3.00% | 93.10% | +3.30% | 70.50% | 92.90% |
| Sutton | 1.00% | +0.20% | 6.70% | -0.20% | 92.20% | -0.10% | 77.10% | 91.70% |
| Swansea | 1.20% | -0.20% | 9.20% | -1.00% | 89.50% | +1.20% | 80.70% | 88.80% |
| Swindon | 1.70% | -0.50% | 3.60% | -0.20% | 94.70% | +0.80% | 91.00% | 94.20% |
| Taunton | 5.10% | -0.60% | 20.80% | -0.80% | 74.00% | +1.40% | 72.30% | 73.40% |
| Telford | 5.65% | -0.48% | 16.35% | -4.40% | 77.83% | +4.84% | 62.36% | 77.06% |
| Tonbridge | 3.30% | -0.30% | 12.30% | -5.10% | 84.30% | +5.40% | 75.20% | 83.80% |
| Torquay | 2.00% | -0.20% | 9.00% | -1.20% | 88.50% | +1.60% | 82.30% | 87.10% |
| Truro | 7.10% | -1.60% | 29.70% | -6.20% | 62.80% | +7.80% | 61.10% | 62.50% |
| Twickenham | 1.00% | -0.40% | 7.70% | -1.10% | 91.10% | +1.50% | 66.80% | 90.40% |
| Wakefield | 1.30% | -0.10% | 4.50% | -1.00% | 94.10% | +1.20% | 92.90% | 94.10% |
| Walsall | 0.50% | -0.20% | 5.60% | -2.80% | 93.90% | +3.20% | 84.50% | 93.70% |
| Warrington | 0.60% | -0.60% | 3.10% | -4.40% | 96.20% | +5.00% | 91.80% | 96.00% |
| Watford | 0.77% | -0.19% | 5.15% | -0.97% | 93.93% | +1.16% | 84.86% | 92.89% |
| Wigan | 0.60% | -0.40% | 3.30% | -2.70% | 96.00% | +3.00% | 84.80% | 95.90% |
| Wolverhampton | 0.50% | -0.40% | 1.20% | -1.40% | 98.20% | +1.70% | 95.60% | 98.10% |
| Worcester | 1.89% | -0.27% | 13.17% | -2.70% | 84.83% | +3.02% | 84.23% | 84.34% |
| York | 2.10% | -1.20% | 7.50% | -2.70% | 90.30% | +4.00% | 84.90% | 89.50% |
In 2022, Ultrafast broadband was available to roughly 50% of UK homes, yet the data showed uptake running well behind that availability. That's no longer the story: with Ultrafast now available to 86.41% of UK premises, it has become the connection type most households actually have, not just one they could theoretically get. The remaining gap has narrowed to a smaller group of premises — concentrated in the towns and regions at the bottom of the tables above — that are still waiting on Ultrafast infrastructure to reach them at all.
What was holding households back?
Back in 2022, we identified several reasons why Ultrafast uptake was lagging behind its availability:
- Cost: Ultrafast broadband plans are typically more expensive than Standard and Superfast plans. Many households may not be willing or able to pay the higher fees for these services, especially if their current connection meets their needs. In the current economic climate and the cost of living crisis, this is undoubtedly the key drive in slow uptake.
At the time of publication, Vodafone offers customers:
- Pro II Full Fibre 900 (24 months) £60.00 p/m - Advertised speed: 910 Mbps
- Vodafone Fibre 2 (24 months) £25.00 p/m - Advertised speed: 67 Mbps
The full fibre package comes in at more than double the price of the entry-level package. It's pretty clear to see why many households would take the cheaper option.
- Awareness: A recent YouGov survey revealed that around 36% of people are unsure if their home broadband ISP is full fibre technology or not. This could indicate that around a third of people are either unaware of the technology, aren't yet up to speed on the terminology, or are indifferent about the technology behind their home broadband.
- Necessity: Ultrafast broadband provides much faster speeds than Superfast and Standard connections, but not all users require such speeds. For many, Superfast connections are sufficient for browsing, streaming, and other online activities. The demand for Ultrafast speeds may be lower as a result.
- Market competition: There might be limited competition among Internet Service Providers (ISPs) offering Ultrafast broadband, which can result in less attractive pricing and promotional offers. If more ISPs start to provide Ultrafast services, prices may decrease and uptake could increase.
- Technology adoption curve: It is common for new technologies to experience a lag in adoption, as people often wait to see how the technology evolves, prices drop, or more options become available. As Ultrafast broadband becomes more mainstream and accessible, it is likely that the adoption rate will increase.
- Consumers tied into long contracts: It's quite often the case that the best deals come with lengthy contracts. In many cases, consumers are tied into 24 month contracts, so breaking contract and upgrading could potentially be a very costly exercise.
With the benefit of hindsight, most of these barriers turned out to matter less than we expected. The data above shows uptake catching up with availability almost everywhere, cost hikes and all — largely because full-fibre and gigabit-capable connections increasingly became the default new install (or the default upgrade at contract renewal) rather than a premium households had to actively choose and pay more for.
Did cost remain the greatest barrier for the average household?
UK broadband providers raised prices for their broadband packages in April 2023, with some customers being hit with increases of more than 17%. Major providers such as BT, Sky, and Virgin Media were among those raising their prices, which affected millions of customers.
At the time, we expected those price hikes to further slow the already-lagging uptake of Ultrafast broadband. With the 2025 data in hand, that isn't what happened: Ultrafast uptake rose regardless, from 9.64% to 86.41% of UK premises. Cost pressure evidently didn't stop the shift — most likely because, as older Standard and Superfast infrastructure is retired, full-fibre and gigabit-capable connections have become the only option on offer in more and more areas, rather than a discretionary upgrade.
Consumers are still advised to shop around for the best broadband deals and consider switching providers if they're unhappy with pricing. Some providers may offer discounts or incentives to customers who sign up for longer contracts or bundle their broadband with other services.
Has data usage changed?
Note: the coverage figures elsewhere on this page have been refreshed with 2025 data, but the usage figures below are still the original 2022 numbers — our local coverage database doesn't track monthly data usage, so we can't yet refresh this section the same way.
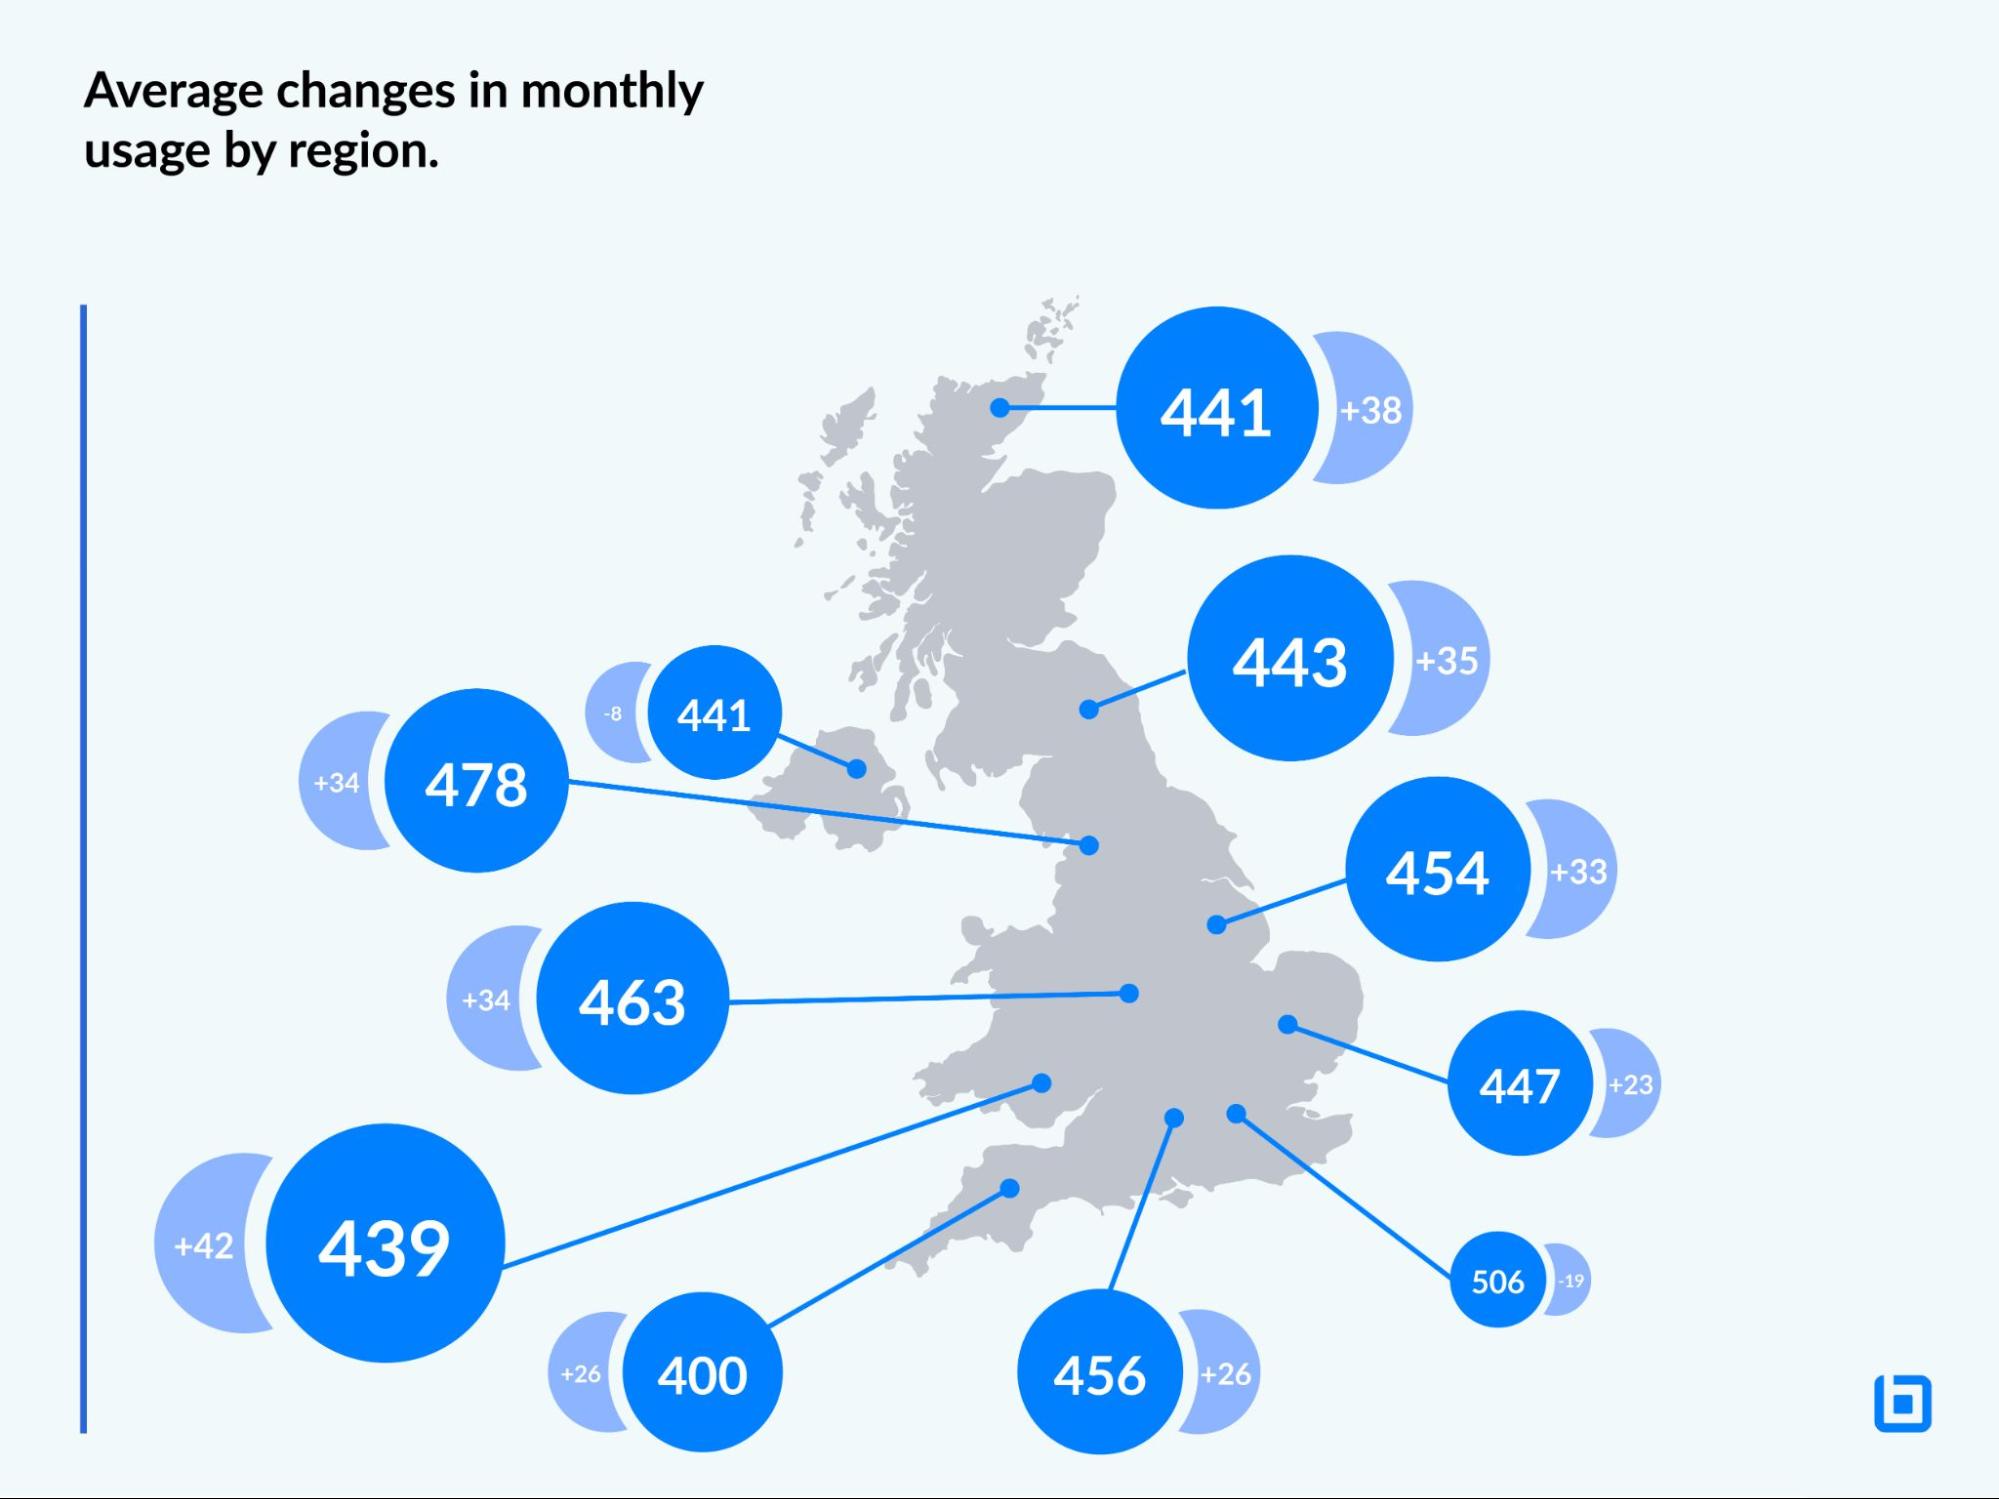
You might recall our UK Internet Usage Statistics report last year, where we used Ofcom data to get a true understanding of how much data UK households use every month. In May 2022, UK households used on average 456 GB/month. The latest Connected Nations report shows this has now increased to 480 GB/month.
Whilst there is likely to be a degree of seasonality in this shift, the increase in Superfast and Ultrafast connections could have contributed to the uplift in usage. Seamless, uninterrupted use of data-intensive online services with faster internet speeds, such as audio and video streaming, could result in increased usage. On the other hand, slow and unreliable connections can frustrate users and deter them from using such services.
Saveen Rajan adds:
“The increase in average data usage from 456 GB/month to 480 GB/month highlights the growing reliance on high-speed broadband for everyday activities. This rise can be attributed to the rising popularity of data-intensive services, the proliferation of smart devices and IoT, and the expansion of superfast and ultrafast connections.”
The following graphic and table shows the average changes in monthly usage by region:
| Region | Avg. Monthly Usage Jan 2022 (GBps) | Avg. Monthly Usage May 2022 (GBps) | +/- |
|---|---|---|---|
| East Midlands | 487 | 454 | 33 |
| East of England | 470 | 447 | 23 |
| Greater London | 487 | 506 | -19 |
| North East | 478 | 443 | 35 |
| North West | 512 | 478 | 34 |
| Northern Ireland | 433 | 441 | -8 |
| Scotland | 478 | 441 | 38 |
| South East | 481 | 456 | 26 |
| South West | 425 | 400 | 26 |
| Wales | 481 | 439 | 42 |
| West Midlands | 497 | 463 | 34 |
In Summary
What we said in 2022:
- The latest Ofcom Connected Nations report shows that uptake of Superfast and Ultrafast has increased in households across the UK, but way behind the rate of rollout of full-fibre connectivity.
- Standard connections have reduced in every region of the UK, with 13.6% fewer households choosing Standard broadband.
- Superfast and Ultrafast increased by 7.9% and 5.7% respectively.
- 76% of households now have Superfast connections.
- Just 9.6% of households have Ultrafast connections, despite reports of full-fibre coverage for 50% of households.
- There are several barriers to adoption of Ultrafast broadband, but cost seems to be the most significant barrier. This will only be exacerbated by the price hikes seen in April, which is likely to price many households out of Ultrafast broadband packages.
- Lack of awareness is also a key factor in the slow uptake of faster home broadband speeds. The Government and ISPs need to do more to educate consumers and familiarise them with the terminology.
What our 2025 analysis shows instead:
- Uptake has essentially caught up with availability: Ultrafast is now the connection type at 86.41% of UK premises, not the lagging minority tier it was in 2022.
- Premises unable to get superfast have kept shrinking in every region: from 14.71% UK-wide in 2022 down to just 2.21% in 2025 — itself another 0.45 points lower than 2024.
- The Superfast-only band — the headline growth story of the 2022 report — is now the one shrinking: down from 75.65% of UK premises in 2022 to just 11.12% in 2025, as those households upgrade to Ultrafast rather than new households arriving into that tier.
- Ultrafast has gone from 9.64% of UK premises in 2022 to 86.41% in 2025 — comfortably past the 50% full-fibre coverage Ofcom was forecasting for March 2023. Our analysis puts full-fibre coverage at 77.64% and gigabit-capable coverage at 85.99%, essentially meeting Project Gigabit's 85%-by-2025 target.
- Cost and awareness were the barriers we flagged as most significant in 2022. The scale of the 2025 shift suggests they mattered less in practice than expected — most likely because full-fibre and gigabit-capable connections increasingly became the default new install or upgrade, rather than a premium households had to actively choose.
Methodology
2022 figures:
- We took Ofcom's Connected Nations data, which has connectivity and usage stats at postcode level.
- We assigned postcodes to streets, towns, cities and regions, to give us totals and averages by location.
- We compared connectivity against Ofcom's announcement of 50% full-fibre connectivity by March 2023.
- We compared connectivity and usage stats against previous Ofcom results.
2025 figures:
- The 2024-2025 comparison figures come from our own local area coverage database, itself built from Ofcom Connected Nations data at local-authority-district level.
- Local authority district figures are premises-weighted up to region, town/city and UK totals, rather than simply averaged, so larger districts count for more.
- Town/city rows are matched to the local authority district(s) that best represent that name; where a name spans more than one district (for example, larger cities split across boroughs), we've blended them on the same premises-weighted basis.
Notes
A limitation of the 2022 data set used is that there isn't a count of individual properties, therefore it was assumed one connection equals one household. There will be instances where properties have more than one connection.
The 2025 figures are drawn from local-authority-district-level coverage data rather than individual postcodes, so very small or unusually-shaped areas may be smoothed slightly compared to a true postcode-level analysis.
Sources
- https://www.ofcom.org.uk/research-and-data/multi-sector-research/infrastructure-research/connected-nations-2022
- https://telecoms.com/520010/ftth-to-pass-half-of-uk-households-in-march/
- https://www.point-topic.com/post/uk-fixed-broadband-bundled-tv-services
- BroadbandUK's local area coverage database, 2024-2025 (Ofcom Connected Nations data, local authority district level)